Written by Jacky Heath for the Hall Marks project.
Jacky Heath digitally transcribed around 40 tithe map apportionments as a volunteer for the Water, Mills and Marshes project between 2019 and 2022. She is one of several individuals and local groups who have donated their transcriptions to the Hall Marks project. Many thanks to all our volunteers who continue to contribute, on and off-site, to our goal of transcribing all 669 Norfolk tithe map apportionment – the Hall Marks project team.
‘I was born to do this’
I once remarked that I was ‘born to do this’, meaning the Tithe Map survey for the Water, Mills and Marshes project. Here I go back to my primary school in the 1950s. On the backs of our exercise books or jotters, which we wrote in daily, were useful tables of weights and measures including rods, poles and perches (for 1,001 ways to measure anything in the landscape that doesn’t move, see the excellent Wikipedia entry).
At the start of the project in 2019, Professor Tom Williamson gave me a list of parishes for study, in and around the Halvergate Marshes. The first thing I did was to establish a worksheet template with all the Excel ‘rules’ in place, to be copied and used ad infinitum.
Deep Thought and decimalisation
Those of you who can take an Excel sheet, swing it around a lamppost and tie it in a bow should skip the next bit. I think of Excel as being like Deep Thought, the computer which calculated the meaning of Life, the Universe and Everything. I can’t even say that I used the tip of the iceberg of its mighty power, more like a snowflake on the surface.
In Excel, worksheets are structured as a grid where columns are identified by letters (A, B, C) and rows by numbers (1, 2, 3). The intersection of a row and a column forms a ‘cell’ (e.g., A1, B5) which holds individual pieces of text, numbers or formulae (Figure 1).
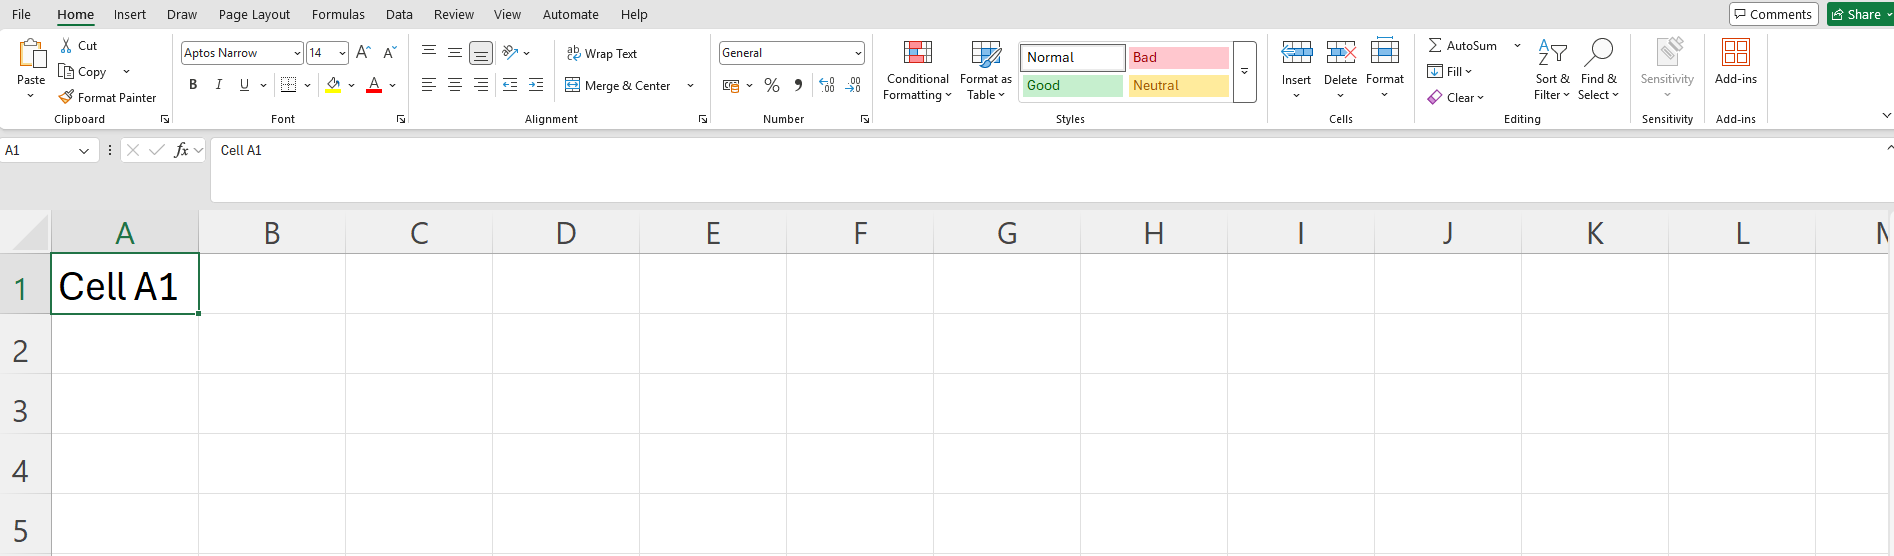
Figure 1. Example of an Excel spreadsheet.
My intention was to standardise the (potentially) forty-one worksheets for readers yet to come – as indeed the original handwritten versions of the tithe map apportionments had been in the 1830s.
The headings for the columns in my Excel worksheet were those used in the tithe map apportionments. Superficially, these appear to be just letters or numbers – names, plot numbers, currency, for example – however to utilise the power of the Excel sheet, cells within each column had to be formatted (Figure 2).
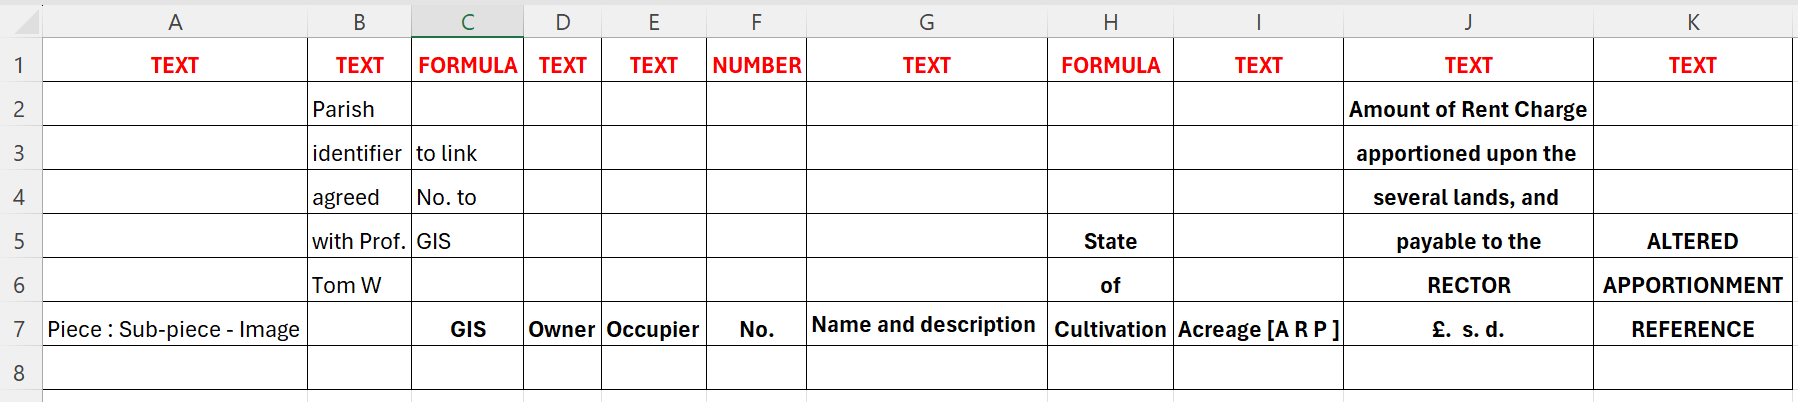
Figure 2. Cell formatting type (in red) and column headings used during the tithe map apportionment transcriptions.
Stipulating in Excel how the cells were formatted would allow easier sorting or searching of the data. By default, cells are formatted as ‘General’. Specialist formats include ‘Text’, ‘Number’ and ‘Date’ (check that the Locale (Location) is set to English (United Kingdom). It has numerous implications when using dates or times).
I used ‘Conditional formatting’ for my own benefit so that I could see, at a glance, whether a plot was under ‘Arable’ or ‘Pasture’ cultivation. Typing ‘Arable’ automatically turned the cell a mustard colour, typing ‘Pasture’ turned it green.
Under ‘Amount of Rent Charge Apportionated upon the Several Lands and payable to the RECTOR’ I considered having three columns for pounds (£), shillings (s) and pence (d) but came up against (to me) the intransigence of Excel to recognise anything other than a decimal coinage system. Just in case you come from the planet Zog, the letters stood for Latin words: £ (libra for pound), s (solidus for shilling), and d (denarius for penny). There were 12 pennies in a shilling and 20 shillings (or 240 pence) in a pound. Then it all changed on Decimal Day, February 15, 1971.
Compare and contrast
Information was listed on the tithe apportionments in alphabetical order by landowner. One of the benefits of the digital transcription is that the data in the worksheet can be reordered. This is particularly useful when consulting the original tithe maps, which only have numbers indicated on the plots. Sorting the transcriptions by plot number saves a lot of time during searches.
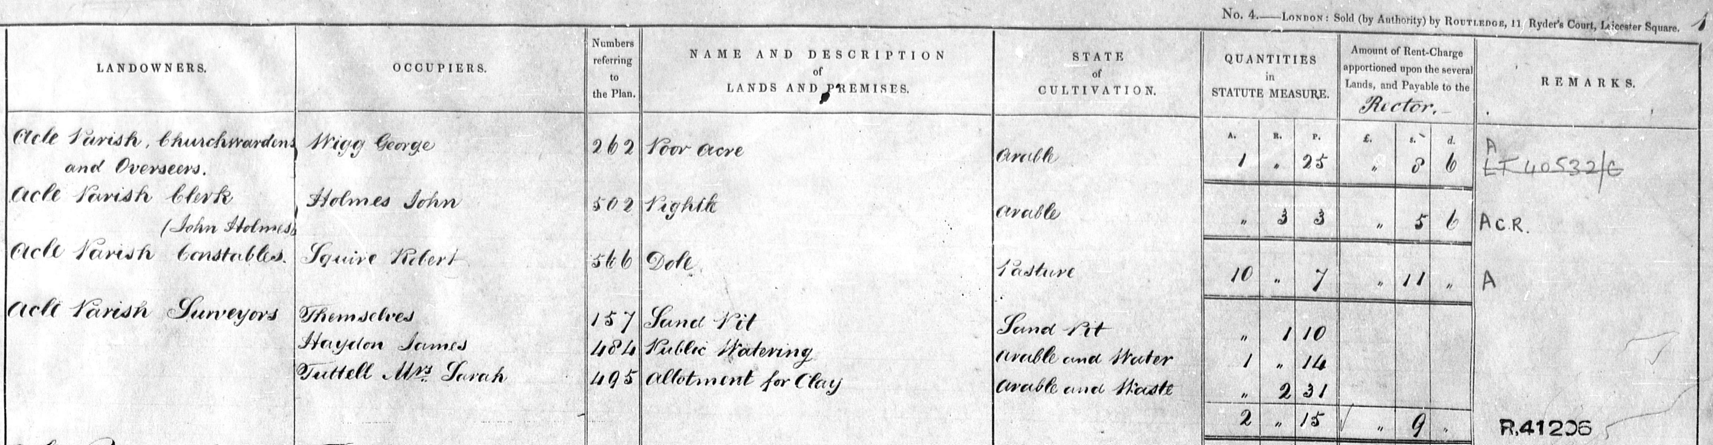
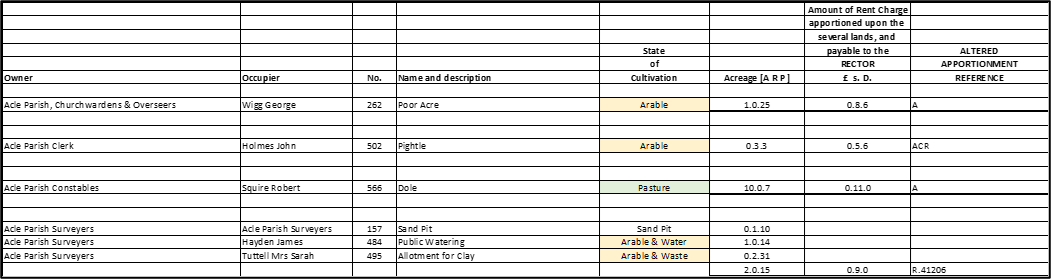
Figure 3. Original tithe map apportionment entry for Acle (NRO PD 164/16) and the digital transcription (use slider to reveal).
So, to conclude, we read in the first line of the tithe map produced for Acle, in the Year of Our Lord 1838, that the Plot 262, owned by the Churchwardens of Acle Parish, was occupied by George Wigg. It was cultivated as Arable land and valued at the sum of £0 8s 6d for 1 acre 0 rods and 25 perches.
We cannot ascertain from the tithe map itself (Figure 4) or its apportionment (Figure 3) whether the plot described as ‘Poor Acre’ was part of a poor relief scheme for the parish, rubbish land or both.
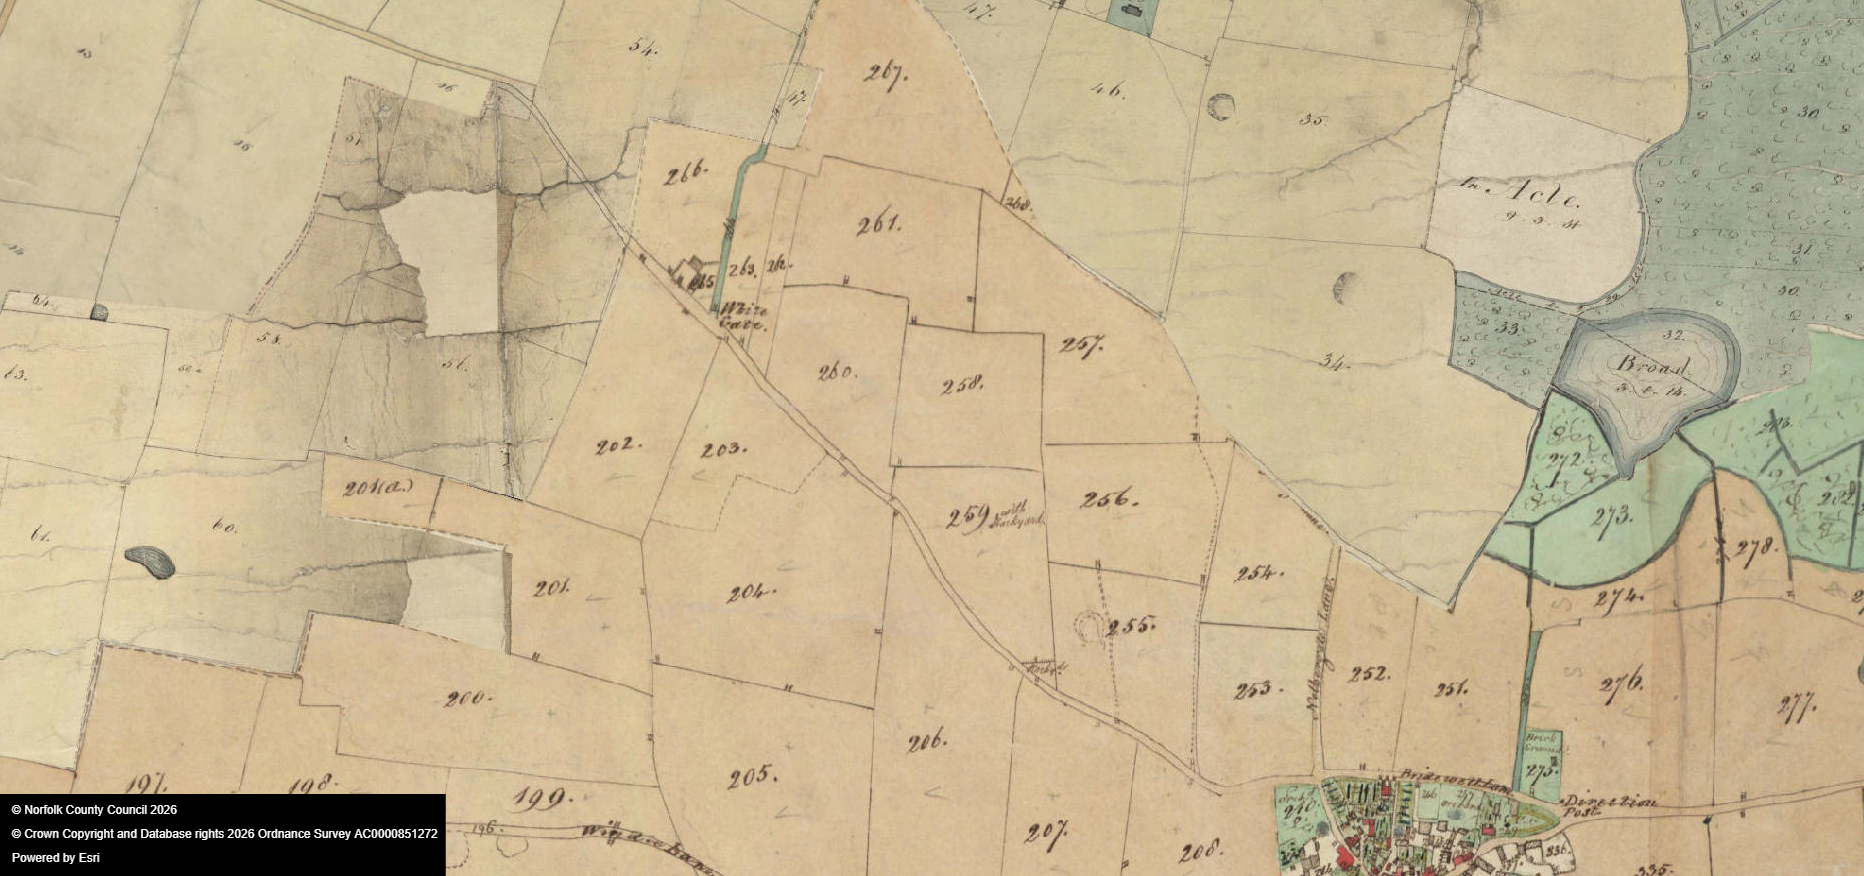
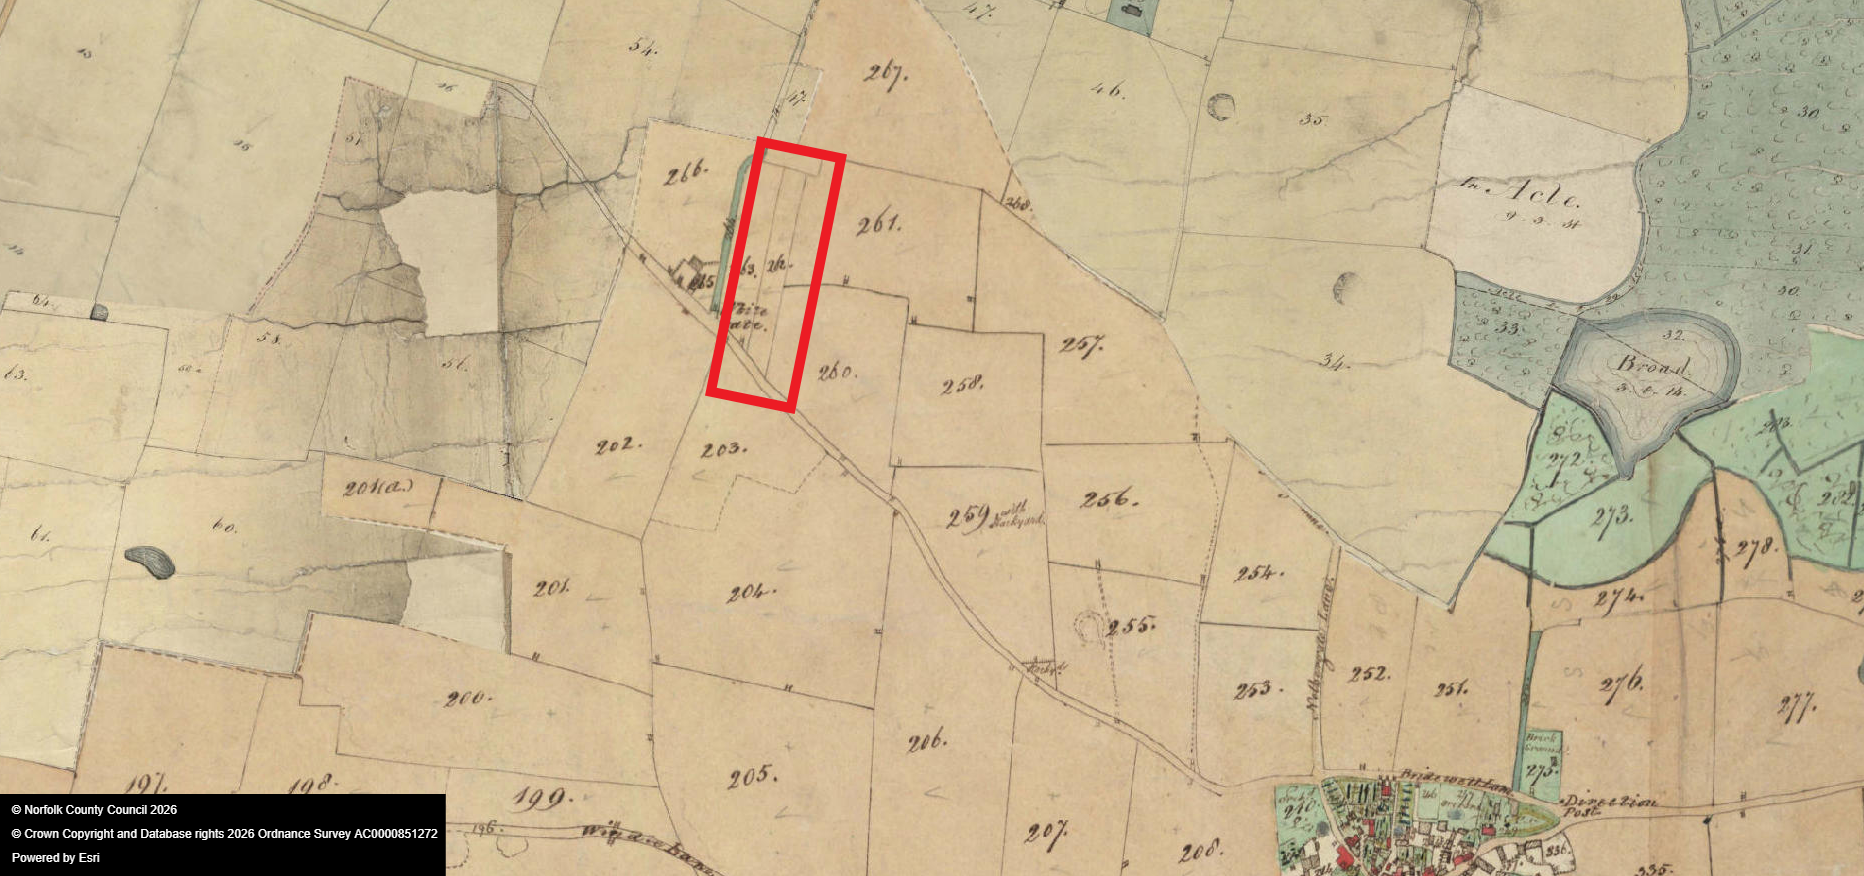
Figure 4. Extract from the tithe map for Acle (NRO PD 164/16). Plot 262 is high-lighted (use slider to reveal).