
Living in a vibrant, busy and ever-changing city like Norwich can distract us from noticing the changes around us. The streets we live on, the places we work, the pubs in which we drink (responsibly of course) have drastically changed through the centuries, or have they? By using several maps and town plans, that are easily accessible from the Norfolk Record Office, we can see just how our beloved city has changed.
Does a city like Norwich change its layout over time? Or do we see more continuity than development? What characteristics of a city are likely change over several generations? What do town plans and maps tell us about the people that lived there? These are all questions I aim to answer.
The Norfolk Record Office holds a collection of maps dating back to the late 16th century which can be used to highlight the expansion that the city of Norwich has undertaken. Whilst holding a wide selection of original maps, the archive also holds facsimiles of many of the maps in the collection which are easily accessible within a folder in the main search room.
One considerable change in maps through the centuries is the styling. What we see especially in earlier maps, like the Yarmouth Hutch map (NRO, Y/C 37/1), are vivid drawings taking centre stage. The Yarmouth Hutch map depicts the Norfolk/Suffolk coastline with South at the top of the map and North at the bottom. Although the map is rather vague it shows us what was important to the people who constructed it. Norwich is marked by a drawing of the cathedral and a number of buildings, so we can infer that it is the most densely populated urban area and that, because of the cathedral, it was the powerhouse for prayer in Norfolk. Religion was a key pillar of society especially during the middle ages and the early-modern period. Norwich Cathedral and depictions of other churches dotted around the East-Anglian coastline on the map show religious buildings were central to village and town plans.
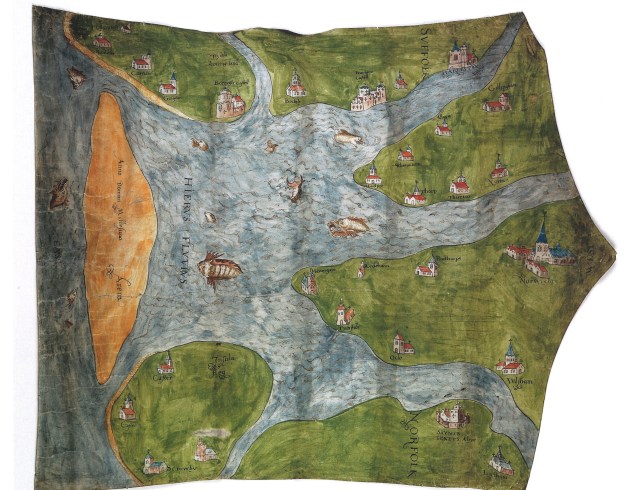
Great Yarmouth Hutch Map, made in the sixteenth century, perhaps by Thomas Damet of Yarmouth. The map shows the Yare Valley as it was thought to be in the year 1000 AD. NRO, Y/C 37/1.
Moving into the 18th century we see maps that have much greater detail, such as the map of 1727 created by John Hoyle (NRO, RYE 9 vol. 1). Hoyle’s map clearly outlines the streets of Norwich with clear reference to buildings, the castle and crucially the city walls. Along with the castle, the city walls acted almost as a defence mechanism and were a common feature of many towns and cities across England. Norwich’s city walls were initially built around 1294-1343 out of flint and were slowly reinforced with stone over time. The city walls are a good indicator of Norwich’s expansion as we shall see in other maps. One continuity from the Yarmouth Hutch map is the distinct reference to the importance of religion. Except for Norwich Cathedral and the castle, the only labelled buildings, as indicated with numbers and a key in the bottom right-hand corner, are the various parishes within Norwich. Clearly religion and a reference for people to know exactly where they could go to pray was crucial even as late as the 18th century.
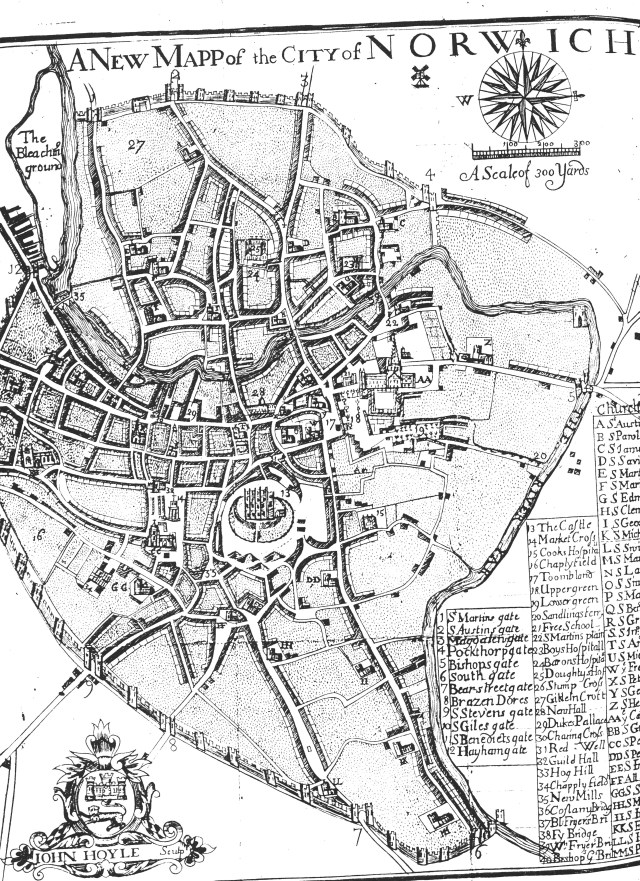
Detail of facsimile of John Hoyle’s map of Norwich, 1728 which can be viewed in the Norfolk Record Office search room. Original document: NRO, RYE 9 vol. 1.
Although the style of the map is similar to John Hoyle’s in 1728, the map of Norwich from 1830 demonstrates a greater level of detail. Once again, the location of multiple parishes are depicted using darker colours, highlighting their significance. However, the key difference between the two maps is the fact that by 1830 there seems to be buildings starting to appear beyond the original city walls (the city walls are the long curve beginning at the bottom of the centre of the page and ending as straight road at the top). This is mainly due to a steadily growing population. During the time of John Hoyle’s 1728 map the population of Norwich was around 25,000, by 1830 the population was around 36,000, so more houses had to be built to match the growth. Norwich’s expansion is the key point to take away from this map especially as the majority of the city is now found beyond the original walls.

Plan of the city of Norwich, 1830, surveyed by W S Millard and Joseph Manning and engraved by J Dallinger. NRO, N/EN 20/185.
One of the most revealing maps depicting the expansion of Norwich was created in 1945. We see the original outline of the city walls in the area marked by diagonal lines in the centre of the map (NRO, N/EN 20/152). We also see the expansion which took place between 1800-1870, as depicted in the map from 1830. Significantly, we see a growth in the number of buildings and area of land usage between the years of 1871 and 1899. This is largely due to the introduction of industry in the area during the British Industrial Revolution. The Ordnance survey map from 1907 (NRO, ACC 2010/169) shows the extensive goods yards and railway station which became, and remained, prominent features of the city. This allows us to infer that the buildings built during the period from about 1870 to 1907 were mainly houses for the workers. More industry, such as the shoes, clothing and joinery industries of Norwich, of course meant the need for workers, and a need for workers meant a need for housing. We can see this housing started to develop in areas like the inner city, just beyond the city walls, and also areas like Earlham and New Costessey.
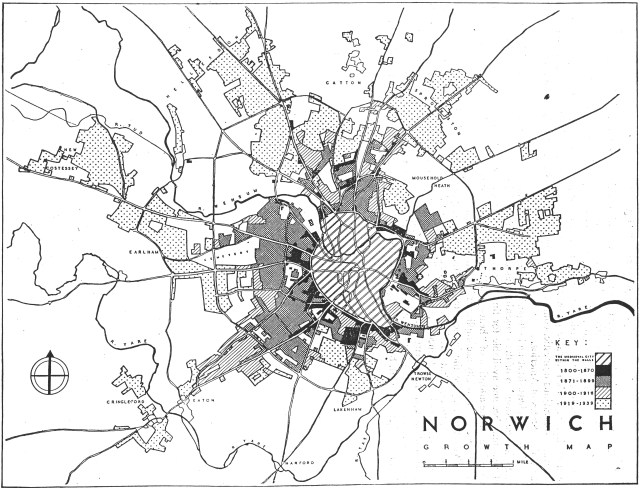
Facsimile of Norwich Growth Map, 1945. This shows the growth of the suburbs of Norwich. Original document: NRO, N/EN 20/152.
Although visual sources don’t give us as much detail as written ones you will be surprised about the amount you can infer and learn from them. Maps and town plans reveal a number of characteristics of a city that sometimes are not mentioned in written manuscripts, such as the expansion of Norwich. Clearly using a range of sources will provide more information, but the wide range of maps found at the Norfolk Record Office can be used to visually reveal key continuities and changes in the urban landscape of our fine city.
Researched and compiled by Ben Johnston.


I love old maps and having lived in Norfolk for 30 years I find it fascinating to see how things have changes (and some things not much!).
LikeLike
Thanks for your comment Jeremy. We love old maps too and have a large collection here at the Norfolk Record Office!
LikeLike